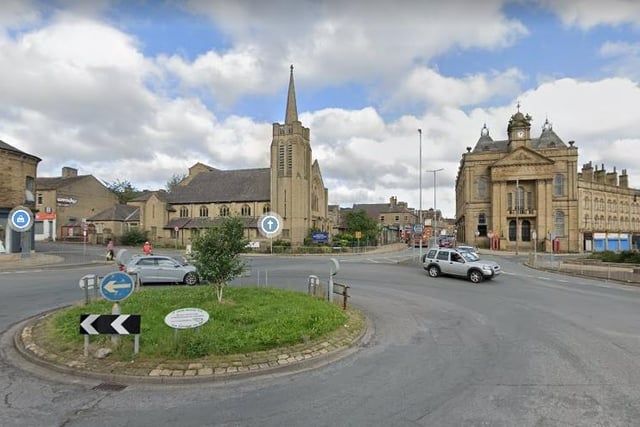
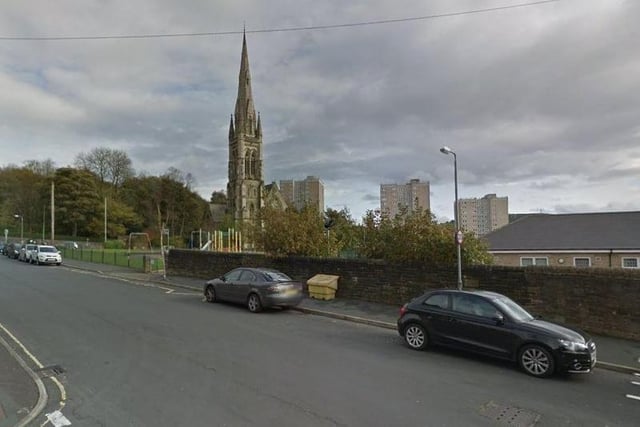
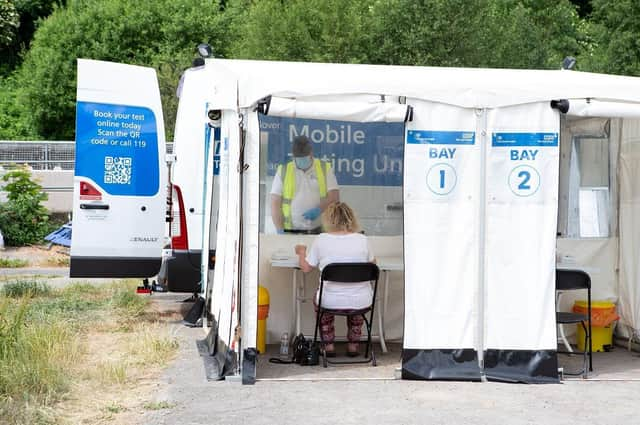
According to the latest Government figures, these are all the confirmed cases of coronavirus in every area of Calderdale over the seven days up to April 14.
Areas where two or fewer cases were confirmed in a given week may not be included in the totals.
The rolling rates are expressed per 100,000.
.
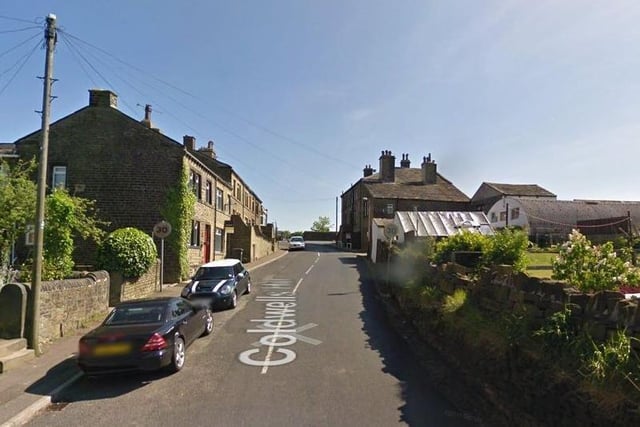
Here are the latest weekly Covid figures for every area of Halifax and the Calder Valley
. Greetland & Stainland
47 cases (down 14 on the previous week). Rolling rate: 496.5
. Elland
45 cases (down 23 on the previous week). Rolling rate: 430.3
. Central Halifax & Boothtown
23 cases (down 9 on the previous week). Rolling rate: 261.4
. Hebden Bridge
38 cases (down 44 on the previous week). Rolling rate: 410.9
. Hipperholme
17 cases (down 31 on the previous week). Rolling rate: 269.9
. Brighouse
28 cases (down 22 on the previous week). Rolling rate: 356.0
. Clifton & Bailiff Bridge
31 cases (down 24 on the previous week). Rolling rate: 334.6
. Mixenden
21 cases (down 13 on the previous week). Rolling rate: 385.8
. Illingworth & Ogden
21 cases (down 12 on the previous week). Rolling rate: 336.7
. Mytholmroyd & Cragg Vale
35 cases (down 21 on the previous week). Rolling rate: 409.6
1. Greetland & Stainland
47 cases (down 14 on the previous week). Rolling rate: 496.5
2. Elland
45 cases (down 23 on the previous week). Rolling rate: 430.3
3. Central Halifax & Boothtown
23 cases (down 9 on the previous week). Rolling rate: 261.4
4. Hebden Bridge
38 cases (down 44 on the previous week). Rolling rate: 410.9