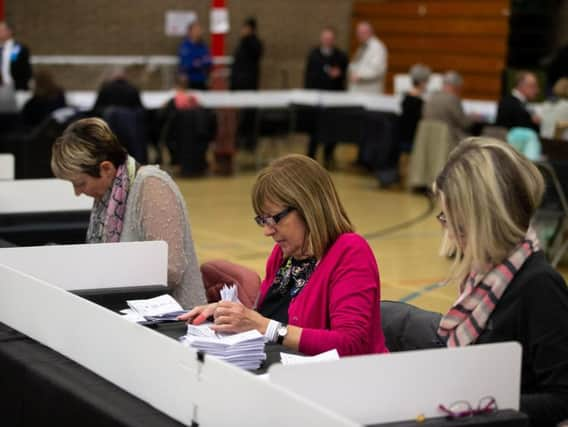
Hundreds of Calderdale ballot papers rejected as election turnout is revealed


Ahead of last week’s poll there was speculation that voters upset at the Brexit situation nationally might not use their vote.
But with average turnout for metropolitan authorities usually around 33 per cent according to Government figures, Calderdale’s voters turned out in more than average numbers, with a mean of 36.71 across the borough.
Advertisement
Hide AdAdvertisement
Hide AdIt depended on in which part of the district you lived as to how big the turnout was, with differences across the borough.
Also turnout figures are likely to be down on four years ago when these particular seats were last contested and national figures showed a 64.6 per cent turnout, because they were held on the same day as that year’s General Election.
Calder ward topped this year’s list, with just over half of eligible voters turning out, while the lowest number voted in Ovenden, at 21.79 per cent.
Advertisement
Hide AdAdvertisement
Hide AdIn an election in which six seats changed hands, the Conservatives losing four to Labour, one to the Liberal Democrats and one to an Independent candidate, there were some of the highest turnouts in wards which were likely to be closely contested and did change hands, notably Luddenden Foot, Ryburn and Skircoat, but Greetland and Stainland and Sowerby Bridge were around the middle of the range and Elland fourth lowest.
The turnout rates ward by ward were as follows: Brighouse, 40.94 per cent; Calder, 50.51 per cent; Elland, 33 per cent; Greetland and Stainland, 36.03 per cent; Hipperholme and Lightcliffe, 34.27 per cent; Illingworth and Mixenden, 26.92 per cent; Luddenden Foot, 43.45 per cent; Northowram and Shelf, 35.29 per cent; Ovenden, 21.79 per cent; Park, 43.21 per cent; Rastrick, 35.8 per cent; Ryburn, 41.6 per cent; Skircoat, 42.7 per cent; Sowerby Bridge, 35.52 per cent; Todmorden, 37.25 per cent; Town, 27.37 per cent; Warley, 38.57 per cent.
There was also speculation nationally ahead of the election that a lot of spoiled ballot papers would be returned, possibly as a protest against the Brexit situation.
In Calderdale 765 ballot papers were rejected.
Again, these varied ward by ward and when compared to four years ago, bearing in mind the higher turnout generally that year, were broadly in line with in the days before the Brexit factor, although the nature of why they were rejected is not reported.
Advertisement
Hide AdAdvertisement
Hide AdThe number of rejected ballots ward by ward was as follows: Brighouse, 22; Calder, 82; Elland, 56; Greetland and Stainland, 55; Hipperholme and Lightcliffe, 63; Illingworth and Mixenden, 33; Luddenden Foot, 64; Northowram and Shelf, 37; Ovenden, 38; Park, 24; Rastrick, 61; Ryburn, 21; Skircoat, 26; Sowerby Bridge, 58; Todmorden, 49; Town, 32; Warley, 44.